News•Viewtracker - Analytics for Confluence
Our new Analytics Report Macro
Explore the new Analytics Report Macro for Confluence!
May 27, 2024Our team was busy crafting new features for Viewtracker – Analytics for Confluence. Read below what’s new.
If you want to get specific insights into your Confluence Usage, Viewtracker’s filters are a convenient way to do so. With the new filters we added, you can:
There is a new Analytics Report: the Space Status Report. It gives an overview of how active a space is. It shows the number of active users vs. inactive ones, which pages are being viewed, and what attachments are being accessed. Graphs help visualize trends and a heatmap shows when the space is busiest. Plus, it lists the most popular content. You can access the Report via Space Report. Find out more about the Space Report for Cloud and Data Center.
We also made it easier for Administrators to control which aspects of your Confluence you want to track in Confluence Cloud and Data Center. In the tab “Manage Tracking,” Administrators can set preferences for Attachment tracking, Search tracking, and more.

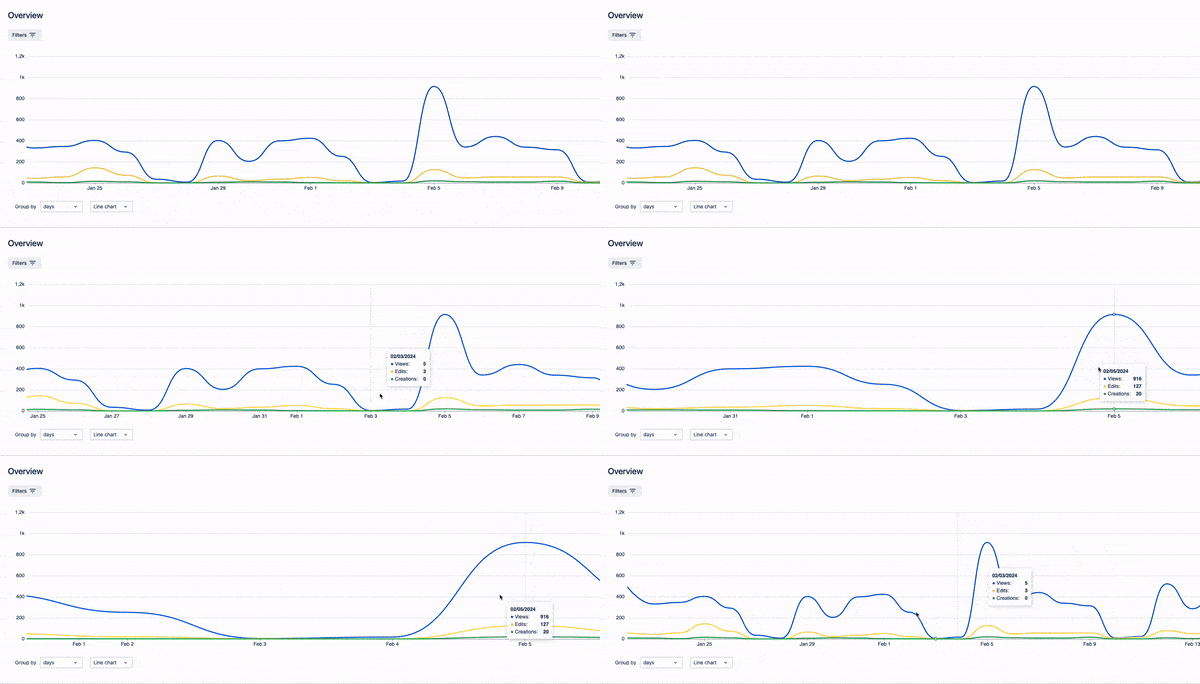
By scrolling, you can now easily zoom into graphs:

For Viewtracker Data Center, it is now possible to exclude several user groups from tracking. Find more information here.

The “Running Queries” feature is a tool for administrators looking to enhance Viewtracker’s performance. This feature provides a real-time snapshot of all ongoing Viewtracker queries used to create the various Viewtracker reports. By accessing the “View queries” link, administrators can oversee the list of active queries, complete with details such as the query name, its start date and time, and the duration it has been running. This list updates every 30 seconds.
Administrators can cancel individual or all queries to free up resources and optimize the app’s performance.
Find out more about running queries in our documentation.
When you first download Viewtracker Data Center, you want to try it out, see how it works and get some insights on Confluence usage in your company. However, since you only just downloaded the app, there probably hasn’t been much Confluence activity that Viewtracker could analyze.
With this new Data Center feature, you can import views that happened before Viewtracker’s installation. This will give you insights into Confluence usage in the past and will fill your Viewtracker reports with relevant information.
There are two ways to import views into Viewtracker:
To access this new feature, navigate to “Tracking” in the Viewtracker Analytics Cockpit and select “Import Views.” Follow the instructions in the interface to import existing views. If you need help, please check out the respective documentation page.
As you may have realized, Atlassian has introduced a new Confluence feature with which you can define the status of pages. By default, users can choose to set the status to “Rough draft,” “In progress,” and “Ready for review,” – but it is also possible to add your custom status. Viewtracker uses this feature as it is now possible to filter for page status specifically. To do so, go to the Space Report and choose “Filter by custom status.”