News•Viewtracker - Analytics for Confluence
Our new Analytics Report Macro
Explore the new Analytics Report Macro for Confluence!
May 27, 2024This article explores two powerful features within Viewtracker – Analytics for Confluence Data Center and Cloud: Pre-built page templates and advanced filtering options using labels. Learn how to use these tools to create and manage your data visualizations efficiently.
bitvoodoo’s Analytics Report macro is a powerful tool for generating custom reports on your Confluence pages and sharing insights with stakeholders. This macro lets you display data without requiring access to Viewtracker reports. While the extensive range of available metrics can be overwhelming, we’ve developed Confluence page templates to streamline the process. These templates provide pre-built data dashboards that can be easily customized to match your needs.
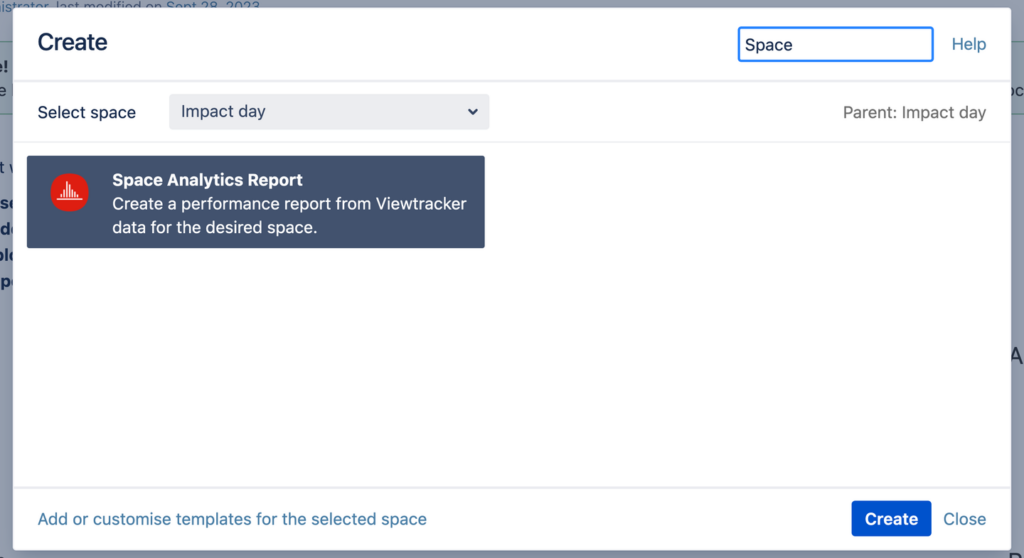
To use the template, we suggest proceeding as follows:
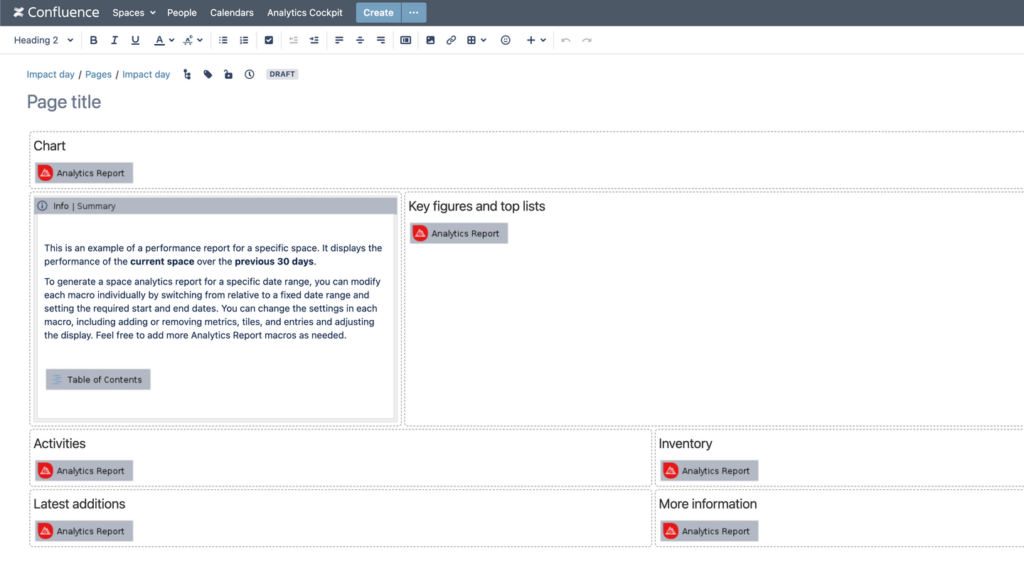
You will then see the following:


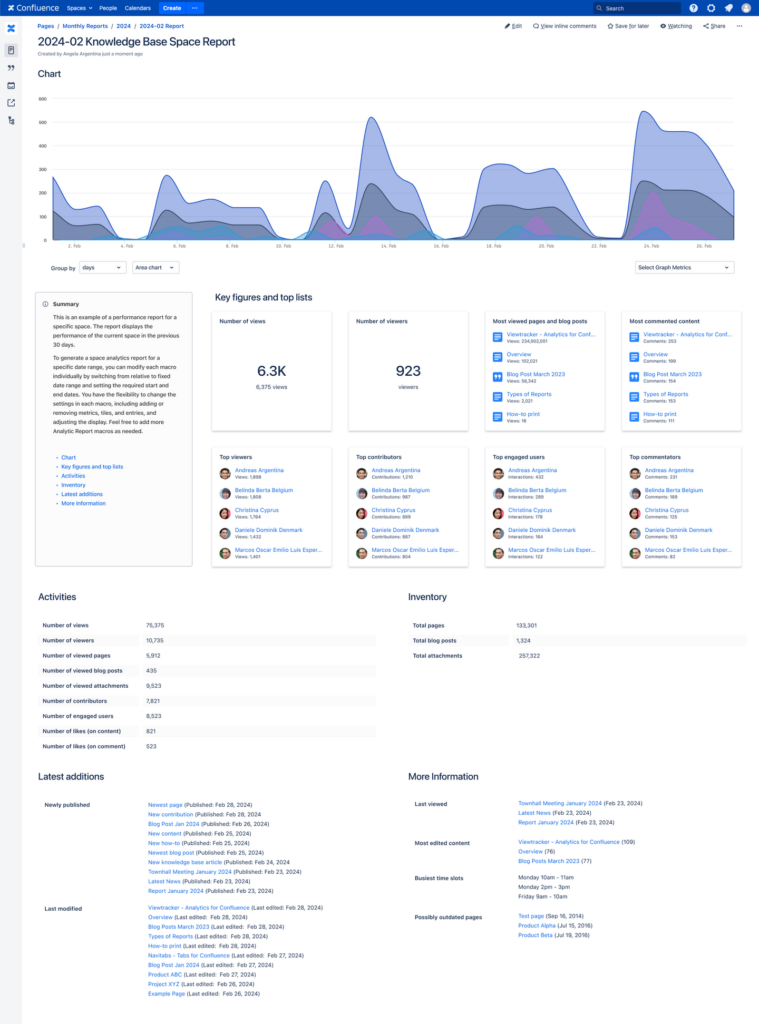
After selecting the Space Analytics Report template, the page will be generated. You only need to set the title and publish the page. You will then see the activities and inventory of the previous 30 days for the current space. Otherwise, you also have the option to choose the desired space and date range for each macro. When the page is published, the result will look something like this:

With this quickly created page template, you gain a holistic overview of key figures, activity inventory of your space, and more, enabling informed decision-making, efficient resource management, and improved space utilization.
In addition to the Confluence page template, there are pre-filled macros. The Top-Users macro, for instance, provides you with the following insights:

There is also a “Popular Content” macro that highlights the popularity of your content. The “Content Activities” macro shows you metrics such as the busiest time slots, number of active users and more. Last, the “Content Inventory” macro shows total pages, attachment storage and other instance-related metrics.
In the Content & Usage Report, the “Content” section also allows you to filter content by labels. If you frequently use Confluence labels, this addition is useful when refining your reports for your company’s needs.
By effectively combining pre-built page templates and advanced filtering options, Viewtracker Datacenter empowers you to swiftly create informative and actionable reports. These tools streamline your data analysis process, providing valuable insights into space utilization, user behavior, and content performance.
Want to experience the power of Viewtracker firsthand? Sign up for our free version and start exploring your data today. Unlock the potential of your space and make data-driven decisions that drive results.