
News•Viewtracker - Analytics for Confluence
Our new Analytics Report Macro
Explore the new Analytics Report Macro for Confluence!
May 27, 2024
Our new Confluence Analytics Report, “Instance Report,” on Viewtracker Cloud and Data Center, includes insights such as storage capacity, number of users, active vs. inactive users, viewed spaces, pages, blog posts, attachments, and more. Charts and graphs visualize activities and trends. The Instance Report is available to all Viewtracker users who have access to the Global Report.
As a Confluence administrator, the big picture is important to you. An efficient license and storage management are key to saving costs and having a fast-running Confluence. Therefore, you may ask yourself questions like:
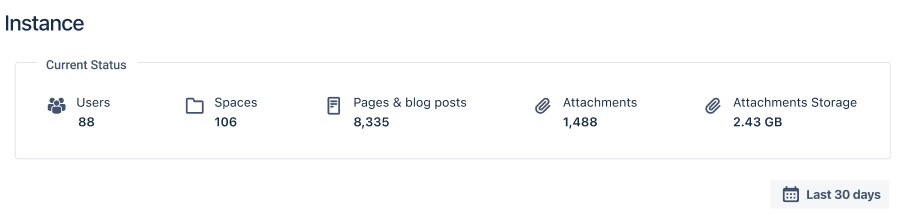
As you may know, Confluence has no such built-in feature (see our full overview of Viewtracker vs Confluence built-in Analytics features). This is why we added a new report to the Viewtracker Cloud & Data Center app where you can find all that information. This is what the new report looks like on Cloud:

The Confluence Instance Report on Data Center and on Cloud has very similar features. The only difference is the upper section “Current Status”:

This first view is only a condensed version of the Instance Report. You can define a date range below the condensed view and tap the “Apply” button. This will create the full Instance Report, which may seem overwhelming at first glance. Let’s look at the individual sections.
The upper part of the section “Activity” consists of 4 parts:
Knowing the number of active and inactive users on your instance will help you with your license management. You can identify unused licenses and reuse them for new employees without paying extra. Data Center customers will find information on how many user licenses are left.

You can see a detailed overview of user activities and a list of inactive users by clicking on the shortcut icon.
Attachments are usually the elements in Confluence that use up most of your storage. Identifying those never opened will allow you to regain storage capacity and make your Confluence faster. This will also prove helpful when performing a cloud migration.
The bar chart below visualizes how the number of content, attachment storage and other key figures have changed over a defined period. This will help you identify trends.

The “Views by time of day” heatmap shows at what weekday and time of day Confluence use is the highest. The darker fields indicate a higher activity. By hovering over each field, you can see the exact numbers.
If you are a Data Center user, this helps you to select the right time slot to run updates. This means downtime will be less of a problem for your Confluence users, and IT teams can avoid working on the weekend or night.
The heatmap is also useful for content creators. Knowing when people are the most active on Confluence will help you find the right time to post your content.

The table “Top spaces based on storage increase” highlights where most storage space is used. Keep an eye on those spaces to identify possible performance problems. You can also view the top 10 spaces by number of active users, number of new pages blog posts, and number of newly added attachments.

Viewtracker’s new Instance Report provides administrators with information about the usage of the Confluence system. It includes insights such as storage use, number of users, active vs inactive users, viewed spaces, viewed pages and viewed attachments. The report also includes charts and graphs to visualize trends. The instance report helps you optimize license management, bandwidth usage, and content relevancy, ensuring an up-to-date and well-maintained Confluence environment.
Dear Confluence admins, we hope this new report will be helpful for you. Please share your thoughts 💭 with our team! For more detailed information concerning the Instance Report, visit our documentation for Cloud and Data Center.

