
News•Viewtracker - Analytics for Confluence
Our new Analytics Report Macro
Explore the new Analytics Report Macro for Confluence!
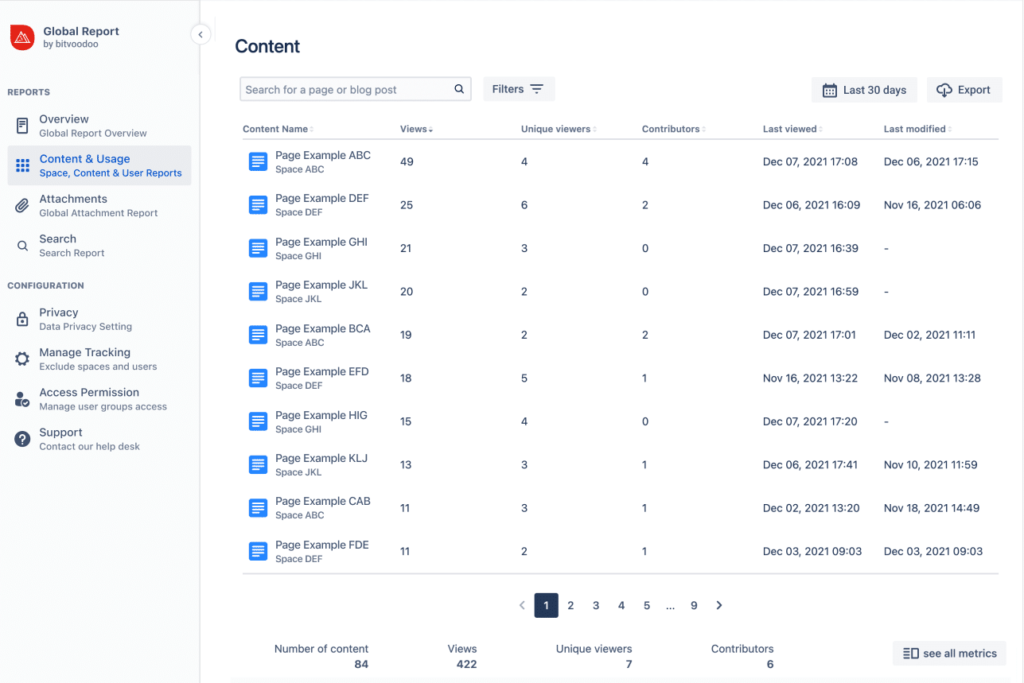
May 27, 2024Viewtracker Cloud customers have a powerful new report at their fingertips: The Content & Usage Report, available on a space and on a global level.
The Content & Usage Report provides more metrics of the overall performance of your Confluence instance in the form of a table.

The report comes with powerful filters to customize your reports. We developed all of these filters because our customers asked for them – and we listened 😊. So we are confident that the filters will be valuable for both new and existing Viewtracker customers.
The report is divided into reports on Spaces, Content, and Users.
All (filtered) metrics can also be downloaded as a CSV file and shared within your company.
📖 Read our dedicated post on possible use cases of this new report.

The Content & Usage Report was released on Viewtracker Cloud in January 2022 and was also rolled out to Data Center & Server in fall 2022.
📕 Suggested reading: Access our full feature comparison of Viewtracker vs. Confluence’s built-in Analytics.
